Tool Call Logs
Tool Call Logs
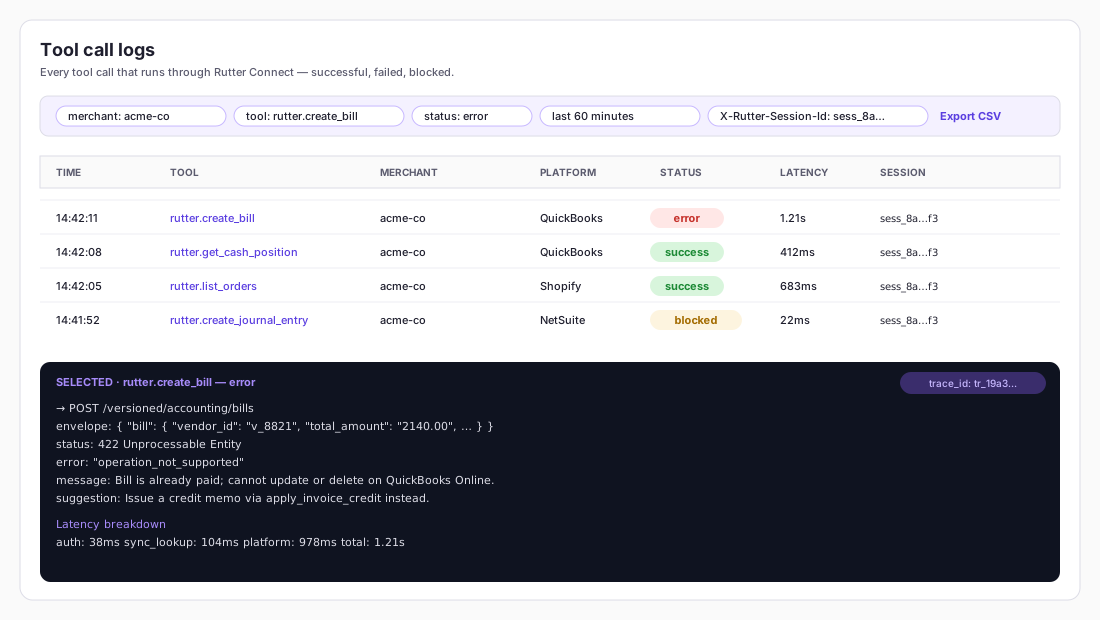
Every tool call that runs through Rutter Connect — successful, failed, blocked — is captured with full context in the Logs dashboard. This is the artifact you'll use to debug the agent, audit who did what, and answer the questions your security team will ask once a customer files a support ticket.
This page covers Tool Call Logs — individual tool executions made by the agent. For HTTP requests your backend makes against the Rutter API itself, see API Request Logs.
What's captured
For each tool call, the log row includes:
- Tool name — namespaced as
rutter.<tool>, likerutter.create_bill. - Merchant — whose connection ran the call, with a link to the connection detail page.
- Platform — the resolved platform behind the connection (QuickBooks, Xero, Shopify, etc.).
- Status — success, error, or blocked-by-confirmation.
- Latency — total time from receipt to response.
- Arguments — exactly what the agent passed in, after envelope wrapping.
- Result — exactly what was returned, including the
connection { company_name, connection_id, platform }envelope. - Errors — for failed calls, the structured
error/error_code/suggestionpayload from the upstream platform. - Custom headers — any
X-Rutter-*headers your client sent on the request, useful for tracing. - Timestamp — when the call started.
Everything is searchable. The full row is exportable.
Filtering
The filter bar covers the dimensions you'll reach for:
- Merchant. Find every call a specific merchant made. Type to search by
connection_idorcompany_name. - Tool name. Narrow to a single tool, or to all writes by selecting the
create_*,update_*, ordelete_*prefix. - Platform. Useful when one merchant has both an accounting and a commerce connection and you want to scope debugging to one slot.
- Status. Successful calls only, errors only, blocked-by-confirmation only.
- Date range. Last 15 minutes, last hour, last 24 hours, or a custom window.
- Custom header values. If you set
X-Rutter-Session-Idor any otherX-Rutter-*header on the MCP request, you can filter by it. This is how you correlate a session in your own UI with the underlying tool calls.
Filters compose. "All rutter.create_bill calls for acme-co in the last hour with status error" is one combined query.
Drilling into a single call
Click any row to open the full call detail. You see:
- The full arguments JSON, including the
{ "<resource>": { ... } }envelope wrapping that Rutter Connect applied. - The full result JSON, including the
connectionenvelope and anysource_urldeep link on writes. - The Rutter API request to the platform (URL, method, headers; bearer redacted) and the platform's raw response.
- A latency breakdown across auth, dual-slot session lookup, mapper dispatch, and the platform round-trip.
For a failed call, you also get the structured error class — operation_not_supported, platform_unsupported, auth_error, not_found, rate_limit_exceeded, connector_error — and the upstream message.
Debugging a failure
The flow for "the agent's tool call didn't do what I expected":
- Find the call. Filter to the merchant and the tool, narrow by time. The call should be there within seconds of the agent running.
- Check status. If it's a success but the result was wrong, the issue is upstream — the platform returned what it returned. If it's an error, read the error class.
- Read the arguments. Did the model pass what you expected? If not, the fix is usually a tighter system prompt, or guarding the agent with
get_active_connectionbefore the write. - Check the structured error.
operation_not_supportedandplatform_unsupportedship with asuggestionfield —update_account(status=inactive)instead ofdelete_account, reverse the JE instead of deleting on NetSuite, etc. The agent can recover from these without retry loops. - Check the platform request. For
auth_error, the merchant's stored credentials are bad — re-run Rutter Link for that connection. Fornot_found, the resource doesn't exist or the merchant doesn't have access. Forrate_limit_exceeded, the platform's quota is the bottleneck.
Retention and export
Tool Call Logs are retained for 90 days on standard plans, longer on enterprise. Beyond retention, individual calls aren't queryable through the dashboard.
Bulk export is available from the dashboard for any filtered view. CSV with one row per call.
If you've passed origin_company_id on your merchant connections, the merchant detail page has a pre-filtered tool-call view — useful for "show me everything Acme did this week."
Next
- API Request Logs — debug your backend's calls to the Rutter API itself.
- Troubleshooting & FAQ — common errors, symptoms, and fixes.